The 5 Pillars of Refrigeration Diagnosis: Professional HVAC

SEO FOCUS KEYPHRASE (191 characters max)
Refrigeration Diagnosis Five Pillars Method: Superheat, Subcooling, Saturation Temperature, Discharge Temperature, Pressure Measurements for HVAC Technician Troubleshooting
SEO TITLE (for WordPress)
5 Pillars of Refrigeration Diagnosis: Complete Superheat Subcooling Saturation Temperature Guide for Professional HVAC Technicians
META DESCRIPTION (155 characters)
Master the 5 pillars of refrigeration diagnostics. Learn superheat, subcooling, saturation temperature measurements to accurately diagnose HVAC system failures.
SLUG (for WordPress URL)
text5-pillars-refrigeration-diagnosis-superheat-subcooling-saturation
TAGS (comma-separated)
textMbsmgroup, Mbsm.pro, mbsmpro.com, mbsm, refrigeration diagnosis, superheat, subcooling, saturation temperature, HVAC troubleshooting,
pressure temperature chart, refrigerant charge verification,
compressor discharge temperature, evaporator coil diagnosis,
condenser performance, manifold gauge set,
HVAC technician training, refrigeration circuit diagnostics, system undercharge, system overcharge, refrigeration maintenance
EXCERPT (first 55 words)
Professional HVAC technicians rely on five critical diagnostic pillars: suction pressure, discharge pressure, superheat, subcooling, and saturation temperature relationships. Mastering these five measurements eliminates guesswork, accurately identifies refrigeration problems, and ensures proper system troubleshooting without expensive callbacks or equipment damage.
ARTICLE CONTENT
The 5 Pillars of Refrigeration Diagnosis: Professional HVAC Troubleshooting Method That Eliminates Guesswork
Introduction: Why Most HVAC Technicians Fail at Refrigeration Diagnostics
Every professional HVAC technician has experienced it: standing in front of a malfunctioning refrigeration system, manifold gauge set in hand, confused by conflicting pressure readings and uncertain about the actual problem. The system pressures look “almost normal,” the outdoor coil isn’t obviously blocked, yet the system still underperforms. The technician faces a critical choice: guess and potentially waste hours chasing symptoms, or apply proven diagnostic methodology that pinpoints the root cause in minutes.
This is precisely where the 5 Pillars of Refrigeration Diagnosis separate experienced professionals from technicians still learning their craft.
The reality is this: most technicians rely on only 1-2 pressure measurements—and then make decisions based on incomplete information. Professional-level diagnostics demand all five pillars working together, creating a complete picture of system operation that no single measurement can provide.
What Are the 5 Pillars of Refrigeration Diagnosis?
The five foundational diagnostic measurements that reveal everything happening inside a refrigeration circuit are:
Pillar 1: Suction Pressure (Low-Side Pressure)
Pillar 2: Discharge Pressure (High-Side Pressure)
Pillar 3: Superheat (Refrigerant Vapor Superheat at Evaporator Outlet)
Pillar 4: Subcooling (Refrigerant Liquid Subcooling at Condenser Outlet)
Pillar 5: Saturation Temperature Relationships (Pressure/Temperature Conversion)
These five pillars interconnect to form a diagnostic framework where each measurement validates or contradicts the others, ensuring accuracy that single-point testing cannot achieve.
Pillar 1: Understanding Suction Pressure and Its Meaning
What is Suction Pressure?
Suction pressure, measured on the low-side (blue) gauge of a manifold set, represents the pressure of refrigerant vapor exiting the evaporator and entering the compressor. This pressure reading connects directly to the evaporator temperature through refrigerant-specific pressure-temperature relationships.
How to Measure Suction Pressure:
Connect manifold gauge low-side hose to the suction line service port (typically located on the compressor suction inlet). Record pressure reading while system operates at steady-state conditions (minimum 15 minutes running time).
Critical Relationships:
| Suction Pressure Range | Interpretation | Primary Cause | Secondary Concern |
|---|---|---|---|
| Excessively Low (<30 psi for R-134a) | Evaporator starved for refrigerant or severely restricted | System undercharge OR blocked metering device OR low airflow | Compressor low oil level risk |
| Below Normal (30-60 psi for R-134a) | Less cooling capacity than design specification | Developing undercharge OR partial blockage | Monitor compressor for liquid slugging |
| Normal Range (60-85 psi for R-134a at 40°F evap) | System operating at designed capacity | Proper refrigerant charge | Continue normal monitoring |
| Above Normal (>100 psi for R-134a) | Excessive evaporator temperature OR high evaporator load | Metering device failure OR air subcooling overload | Check airflow and indoor coil condition |
| Extremely High (>120 psi for R-134a) | Evaporator operating hot; not removing heat | Complete metering device blockage OR severe overfeeding | Risk of compressor thermal overload |
Professional Insight: Suction pressure alone tells you about system capacity but not why capacity changed. This is why suction pressure must always be evaluated with superheat and discharge pressure.
The Critical Error Most Technicians Make:
Technicians see “normal” suction pressure and assume the system operates correctly—this is false. Normal suction pressure with abnormal superheat indicates serious problems that normal-looking pressure masks. Always measure superheat regardless of pressure readings.
Pillar 2: Discharge Pressure and Compressor Heat Stress
What is Discharge Pressure?
Discharge pressure, measured on the high-side (red) gauge, represents the pressure of refrigerant vapor immediately after compressor discharge. This pressure directly correlates to compressor discharge temperature and workload.
How to Measure Discharge Pressure:
Connect manifold high-side hose to the discharge service port (typically on discharge line immediately exiting compressor). Record pressure reading during steady-state operation.
Interpreting Discharge Pressure:
| Discharge Pressure | Ambient Temp Relationship | What It Reveals | Diagnostic Action |
|---|---|---|---|
| Very High (>350 psi R-134a) | Normal/cool ambient | Condenser severely fouled OR restricted airflow OR high suction pressure | Check condenser cleanliness, verify fan operation |
| High (280-350 psi R-134a) | Normal ambient (75-85°F) | Normal for those conditions OR system slightly overcharged | Compare to subcooling measurement |
| Normal (220-280 psi R-134a) | Moderate ambient (70-75°F) | System operating within design parameters | Continue diagnostics with other pillars |
| Low (160-220 psi R-134a) | Mild conditions (<70°F) | Normal for low load OR system undercharged | Measure superheat to determine root cause |
| Very Low (<160 psi R-134a) | Any ambient condition | System severely undercharged OR major system leak | Evacuate, find leak, recharge system |
The Discharge Pressure / Ambient Temperature Relationship:
Discharge pressure always rises with outdoor ambient temperature. A baseline comparison is critical:
- 70°F ambient: Expect 200-240 psi R-134a discharge
- 80°F ambient: Expect 240-290 psi R-134a discharge
- 90°F ambient: Expect 290-340 psi R-134a discharge
- 95°F+ ambient: Expect 320-370 psi R-134a discharge
If your discharge pressure is 40-50 psi higher than expected for current ambient temperature, the condenser requires immediate attention.
Compressor Discharge Temperature Monitoring:
While discharge pressure is measurable with a gauge, discharge temperature is equally critical but requires a digital thermometer or thermal imaging:
| Discharge Temperature | Interpretation | System Status |
|---|---|---|
| 150-200°F | Normal (R-134a systems) | Compressor operating optimally |
| 200-220°F | Moderately elevated | Monitor—verify refrigerant charge and airflow |
| 220-250°F | High—compressor stress | Immediate action required—check refrigerant, condenser, metering device |
| 250°F+ | Critically high—compressor damage risk | STOP—identify and correct problem immediately or risk compressor failure |
Professional Insight: Discharge temperature rises proportionally with suction pressure. Excessively high discharge temperatures with LOW suction pressure indicate superheat problems. Excessively high discharge temperatures with HIGH suction pressure indicate condenser issues.
Pillar 3: Superheat – The Most Misunderstood Pillar
What is Superheat? The Definition That Changes Everything
Superheat is the temperature increase of refrigerant vapor above its boiling point (saturation temperature) at a given pressure.
Understanding superheat requires understanding saturation:
Saturation Temperature: The boiling point of a refrigerant at a specific pressure. For example, R-134a at 76 psi has a saturation temperature of 45°F. At that exact pressure, R-134a boils at 45°F and no higher.
Superheat: The measured temperature of the refrigerant vapor minus its saturation temperature.
Practical Example:
Suction line temperature reads 60°F
Suction pressure reads 76 psi
R-134a saturation temperature at 76 psi = 45°F
Superheat = 60°F – 45°F = 15°F of superheat
This means the refrigerant is 15 degrees hotter than its boiling point—it’s been fully vaporized in the evaporator and then heated further.
How to Measure Superheat:
- Connect manifold gauge low-side hose to suction port
- Record suction pressure reading
- Strap temperature probe to suction line 12-18 inches from compressor inlet
- Record suction line temperature
- Convert suction pressure to saturation temperature (using P/T chart or digital manifold)
- Calculate: Suction Line Temp – Saturation Temp = Superheat
Normal Superheat Values by Metering Device:
| Metering Device Type | Normal Superheat Range | Purpose |
|---|---|---|
| Thermostatic Expansion Valve (TXV) | 8-12°F | Maintains constant superheat to maximize evaporator efficiency |
| Capillary Tube | 15-25°F | Fixed metering—varies with load |
| Fixed Orifice | 10-20°F | Relatively stable but affected by load |
| Electronic Expansion Valve | 5-10°F | Precisely controlled by computer |
What Different Superheat Values Mean:
| Superheat Value | Interpretation | Root Cause | System Impact |
|---|---|---|---|
| Very Low (0-5°F) | Liquid refrigerant entering suction line | System overcharged OR metering device too large OR liquid slugging | Compressor flooding damage risk |
| Below Normal (5-8°F TXV system) | Refrigerant underutilizing evaporator | TXV closing too early OR system overcharged | Reduced capacity, possible hunting |
| Normal (8-12°F TXV system) | Optimal evaporator utilization | System operating perfectly | Best efficiency and capacity |
| Above Normal (12-18°F TXV system) | Refrigerant only partially filling evaporator | System undercharged OR metering device too small | Reduced capacity and efficiency |
| Very High (>20°F TXV system) | Refrigerant exiting evaporator with large temperature margin | Severe undercharge OR major metering blockage | System approaching shutdown conditions |
| Extremely High (>30°F TXV system) | Refrigerant barely cooling evaporator | Critical refrigerant loss OR complete blockage | System failure imminent |
The Superheat / Charge Relationship:
This relationship is so fundamental it forms the basis of professional refrigerant charging:
- Low superheat = Too much refrigerant in evaporator = Liquid entering suction line = Risk of compressor damage
- High superheat = Too little refrigerant in evaporator = Insufficient cooling = Reduced system capacity
Critical Understanding: You cannot diagnose refrigerant charge without measuring superheat. Pressure readings alone are insufficient.
Pillar 4: Subcooling – The Condenser’s Efficiency Indicator
What is Subcooling?
Subcooling is the temperature decrease of refrigerant liquid below its saturation temperature (condensing point) at a given pressure.
Conceptual Foundation:
Inside the condenser, refrigerant begins as high-pressure vapor (after compression). As it passes through the condenser coil, it releases heat and condenses into liquid refrigerant at the condenser’s saturation temperature. As this liquid continues through the condenser coil (the last section is called the subcooling zone), it cools below saturation temperature—this additional cooling is subcooling.
Practical Example:
Liquid line pressure reads 226 psi
R-134a saturation temperature at 226 psi = 110°F
Liquid line temperature reads 95°F
Subcooling = 110°F – 95°F = 15°F of subcooling
How to Measure Subcooling:
- Connect high-side manifold hose to liquid line service port
- Record liquid line pressure reading
- Strap temperature probe to liquid line 6-12 inches from service port or metering device inlet
- Record liquid line temperature
- Convert liquid line pressure to saturation temperature
- Calculate: Saturation Temp – Liquid Line Temp = Subcooling
Critical Measurement Location: Take liquid line temperature before the metering device (expansion valve or capillary tube). After the metering device, pressure drops dramatically, making readings meaningless.
Normal Subcooling Values by System Type:
| System Type | Normal Subcooling | Purpose |
|---|---|---|
| Standard TXV System | 10-15°F | Ensures only liquid (no vapor) reaches metering device |
| Critical Charge System | 12-15°F | Requires more precise charge verification |
| Capillary Tube System | 15-25°F | Works with higher subcooling for reliable operation |
| Accumulator System | 5-10°F | Lower subcooling acceptable due to accumulator |
What Different Subcooling Values Indicate:
| Subcooling Value | Interpretation | Charge Status | Condenser Condition |
|---|---|---|---|
| Very Low (0-5°F) | Minimal condenser cooling | System undercharged | Insufficient refrigerant to fill condenser |
| Below Normal (5-10°F TXV sys) | Less condenser cooling than designed | System undercharged | Possible partial condenser blockage |
| Normal (10-15°F TXV sys) | Optimal condenser performance | Proper charge | Clean, efficient condenser |
| Above Normal (15-20°F TXV sys) | Excess condenser cooling | System overcharged | Condenser oversized for conditions |
| Very High (>20°F TXV sys) | Excessive subcooling | System overcharged | Excess refrigerant packed in system |
The Subcooling / Charge Relationship:
- Low subcooling = Insufficient liquid refrigerant in condenser = Undercharge
- High subcooling = Excess liquid refrigerant in condenser = Overcharge
Subcooling is the high-side equivalent of superheat on the low-side.
Pillar 5: Saturation Temperature – The Conversion Bridge
What is Saturation Temperature?
Saturation temperature is the boiling/condensing point of a refrigerant at a specific pressure. Every refrigerant has a unique pressure-temperature relationship defined by thermodynamic properties.
Why Saturation Temperature Is Critical:
Superheat and subcooling calculations are impossible without saturation temperature. You cannot determine if refrigerant is underheated or superheated without knowing its saturation point at the measured pressure.
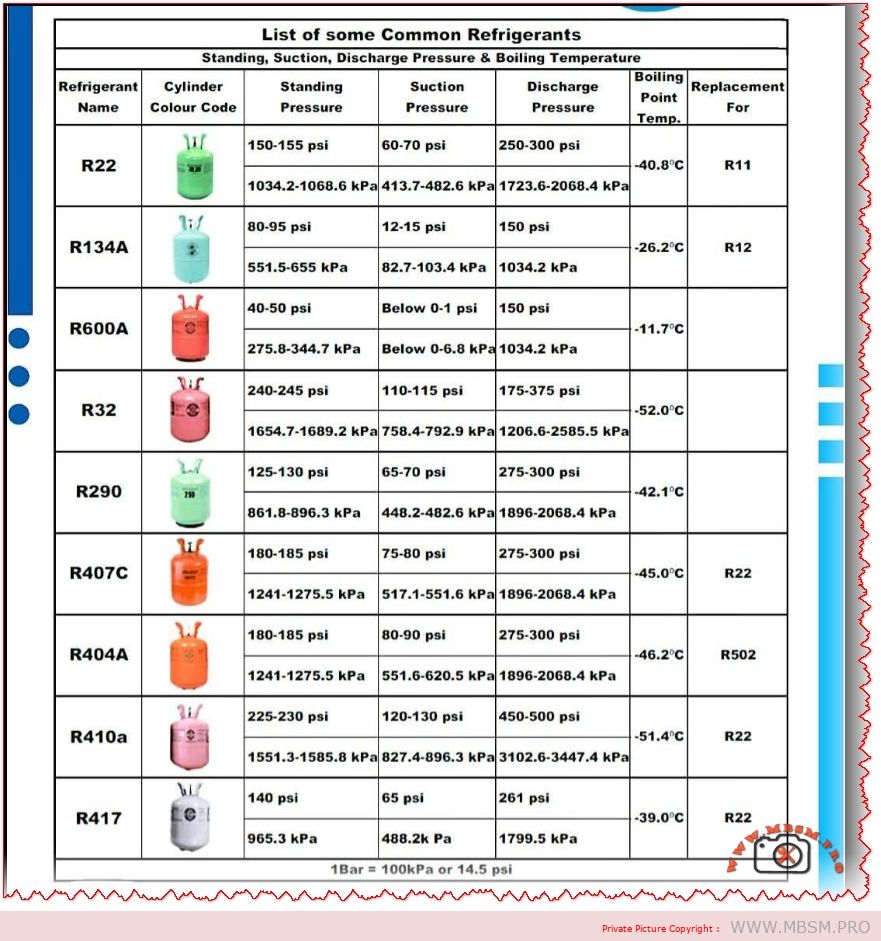
Practical Saturation Temperature Examples (R-134a):
| Pressure (psi) | Saturation Temperature |
|---|---|
| 50 psi | 35°F |
| 76 psi | 45°F |
| 100 psi | 53°F |
| 150 psi | 68°F |
| 226 psi | 110°F |
| 300 psi | 131°F |
How Technicians Access Saturation Temperature:
Method 1: Pressure-Temperature (P/T) Chart
- Physical printed chart in service manual or wallet-sized reference card
- Advantage: No batteries, always available
- Disadvantage: Requires manual lookup, less precise
Method 2: Manifold Gauge Face Printed Scale
- Many analog manifold gauges have saturation temperature printed on gauge face
- Advantage: Integrated with pressure reading
- Disadvantage: Specific to one refrigerant type
Method 3: Digital Manifold Gauge
- Modern digital manifold automatically calculates saturation temperature from pressure reading
- Advantage: Instant conversion, high precision, less calculation error
- Disadvantage: Battery dependent, more expensive ($500-1,500)
Method 4: Smartphone App
- Refrigeration diagnostic apps integrate P/T charts with automatic conversion
- Advantage: Always available, quick lookup
- Disadvantage: Can lose signal, requires phone
Professional Recommendation: Carry both printed P/T chart and digital conversion method. Digital tools fail at critical moments—a printed chart is your backup.
The Saturation Temperature Application in Diagnosis:
Every diagnosis using superheat or subcooling follows this formula:
Step 1: Measure pressure (suction or discharge)
Step 2: Convert pressure to saturation temperature
Step 3: Measure actual line temperature
Step 4: Calculate difference = superheat or subcooling
Step 5: Compare to normal range for that system type
Step 6: Determine charge status or component malfunction
Without saturation temperature, steps 2-6 are impossible.
How the 5 Pillars Work Together: The Diagnostic Process
Professional diagnosis means measuring ALL FIVE pillars, then comparing results to identify system problems.
The Complete Diagnostic Sequence:
Step 1: Record Ambient Conditions
- Outdoor temperature
- Indoor temperature
- System runtime (minimum 15 minutes)
- System load level
Step 2: Record All Five Pillar Measurements
| Measurement | How to Record | Tool Required |
|---|---|---|
| Suction Pressure | Connect low-side gauge to suction port | Manifold gauge set |
| Discharge Pressure | Connect high-side gauge to discharge port | Manifold gauge set |
| Suction Temperature | Measure suction line 12-18″ before compressor | Digital thermometer |
| Liquid Line Temperature | Measure liquid line 6-12″ before metering device | Digital thermometer |
| Ambient Temperature | Measure air entering condenser | Thermometer or IR thermometer |
Step 3: Calculate Superheat
Suction Pressure → Convert to Saturation Temp → Calculate (Suction Temp – Sat Temp) = Superheat
Step 4: Calculate Subcooling
Liquid Pressure → Convert to Saturation Temp → Calculate (Sat Temp – Liquid Temp) = Subcooling
Step 5: Analyze All Five Pillars Together
| Superheat | Subcooling | Suction Pres | Discharge Pres | Diagnosis |
|---|---|---|---|---|
| High | Low | Low | High | SYSTEM UNDERCHARGED |
| Low | High | High | Very High | SYSTEM OVERCHARGED |
| High | High | Low | Very High | CONDENSER BLOCKAGE or HIGH-SIDE RESTRICTION |
| Low | Low | Normal | Normal | METERING DEVICE FAILURE or LOW-SIDE RESTRICTION |
| Normal | Normal | Normal | Normal | SYSTEM OPERATING CORRECTLY |
Real-World Diagnostic Scenarios: How Professionals Use the 5 Pillars
Scenario 1: Customer Complaint—”System Not Cooling Like It Used To”
Measurements Recorded:
- Suction Pressure: 45 psi
- Suction Temperature: 55°F
- Discharge Pressure: 280 psi
- Liquid Temperature: 90°F
- Ambient: 80°F
Calculations:
- R-134a at 45 psi = 32°F saturation
- Superheat = 55°F – 32°F = 23°F (VERY HIGH)
- R-134a at 280 psi = 110°F saturation
- Subcooling = 110°F – 90°F = 20°F (NORMAL)
Diagnosis: System is undercharged. High superheat indicates insufficient refrigerant in evaporator. Normal subcooling confirms condenser function. Refrigerant charge verification and leak detection required.
Erroneous Diagnosis (What Untrained Techs Do):
“Pressures look okay to me.” ← Fails to recognize suction pressure 45 psi is too low. Misses 23°F superheat indicating undercharge.
Scenario 2: Customer Complaint—”System Short Cycles—Keeps Shutting Off”
Measurements Recorded:
- Suction Pressure: 15 psi
- Suction Temperature: 45°F
- Discharge Pressure: 150 psi
- Liquid Temperature: 72°F
- Ambient: 75°F
Calculations:
- R-134a at 15 psi = 12°F saturation
- Superheat = 45°F – 12°F = 33°F (CRITICALLY HIGH)
- R-134a at 150 psi = 68°F saturation
- Subcooling = 68°F – 72°F = -4°F (IMPOSSIBLE—SYSTEM FLASHING VAPOR)
Diagnosis: CRITICAL REFRIGERANT LOSS. Superheat 33°F is far beyond normal. Negative subcooling indicates refrigerant has partially vaporized in liquid line—major leak present. System requires evacuation, leak location, repair, and recharge.
What Happens Next Without Proper Diagnosis:
Technician sees “pressures are low” but doesn’t measure superheat. Adds refrigerant to raise pressures. Creates overcharge condition. System runs worse. Callback occurs. Revenue loss.
Scenario 3: Customer Complaint—”High Electric Bill—System Running Constantly”
Measurements Recorded:
- Suction Pressure: 110 psi
- Suction Temperature: 68°F
- Discharge Pressure: 380 psi
- Liquid Temperature: 115°F
- Ambient: 95°F
Calculations:
- R-134a at 110 psi = 60°F saturation
- Superheat = 68°F – 60°F = 8°F (BELOW NORMAL for TXV—too low)
- R-134a at 380 psi = 141°F saturation
- Subcooling = 141°F – 115°F = 26°F (VERY HIGH)
Diagnosis: System is overcharged. High subcooling with excessive discharge pressure indicates excess refrigerant. Compressor working harder (high suction pressure), consuming more energy (high electric usage). Requires refrigerant recovery and recharge to proper specification.
Additional Finding: Discharge pressure 380 psi at 95°F ambient is excessively high. Even after recharge, verify condenser cleanliness and fan operation.
Common Diagnostic Errors and How to Avoid Them
Error 1: Relying Only on Pressure Readings
Why This Fails:
Pressure readings alone cannot distinguish between multiple causes. High discharge pressure could mean system overcharge, condenser blockage, high ambient, restricted airflow, or combinations thereof.
Solution: Always measure superheat and subcooling. Combine pressure data with temperature data.
Error 2: Assuming “Normal” Pressures = System Works
Why This Fails:
Pressures can appear “normal” while superheat and subcooling reveal serious problems. A system with 70 psi suction and 280 psi discharge might appear normal, but 25°F superheat and 3°F subcooling indicate system undercharge.
Solution: Calculate superheat and subcooling on every service call. Never skip this step.
Error 3: Measuring Line Temperatures at Wrong Locations
Why This Fails:
Suction line temperature must be measured 12-18 inches before compressor inlet (not at gauge connection). Liquid line temperature must be measured before metering device, not after. Wrong measurement locations produce invalid calculations.
Solution: Always measure at consistent, documented locations. Use thermal clamps with insulation to minimize external air influence.
Error 4: Not Accounting for Ambient Temperature Impact
Why This Fails:
Discharge pressure changes directly with outdoor ambient temperature. 300 psi discharge at 75°F ambient is normal. 300 psi discharge at 95°F ambient is dangerously low.
Solution: Record ambient temperature on every call. Compare discharge pressure to baseline for current ambient temperature. Use P/T charts or digital tools to quickly adjust expectations.
Error 5: Confusing Undercharge Symptoms with Other Problems
Why This Fails:
High superheat looks like low airflow or restricted evaporator. But measurements distinguish between them:
- High superheat alone = Undercharge
- High superheat + Low evaporator delta-T = Low airflow
- High superheat + Normal delta-T = Undercharge
Solution: Always measure both superheat/subcooling AND evaporator temperature delta-T. Together, they eliminate confusion.
The Charge Verification Methods: When Superheat and Subcooling Aren’t Enough
Sometimes superheat and subcooling measurements occur under non-ideal conditions (temperature extremes, unusual loads). In these cases, additional charge verification methods ensure accuracy.
Method 1: Standard Charge Verification (Superheat/Subcooling)
When to Use:
- Outdoor temperature 55°F to 95°F
- Indoor temperature 70°F to 80°F
- System operating at normal load (cooling normal indoor heat)
- Steady-state conditions (>20 minutes running)
Advantages:
- No special equipment beyond manifold and thermometer
- Technician-side verification
- Can verify on existing charge without evacuation
Limitations:
- Weather-dependent (can’t verify in winter or extreme heat)
- Requires specific conditions
Method 2: Weigh-In Charge Verification (Factory Weight Method)
When to Use:
- During system installation only
- When factory charge specification exists
- As backup when superheat/subcooling unavailable
Process:
- Obtain factory charge specification (typically printed on equipment nameplate or installation manual)
- Weigh refrigerant tank before use
- Measure line set length and multiply by per-foot charge requirement
- Add calculated charge to system while measuring input weight
- Weigh tank after charging—verify weight added equals calculated requirement
Advantages:
- Most accurate charge verification method
- Not weather-dependent
- Objective measurement
Limitations:
- Installation-only method (factory weight only available on new equipment)
- Requires refrigerant scale ($1,500-3,000)
- Cannot verify existing charge without total system evacuation
Method 3: Non-Invasive Temperature Delta-T Method
When to Use:
- When system pressures are unavailable
- Backup verification method
- Residential HVAC systems specifically
Measurement:
- Measure indoor return air temperature
- Measure indoor supply air temperature
- Calculate delta-T = Return Temp – Supply Temp
- Compare to equipment specification (typically 15-18°F for residential)
Formula Interpretation:
- Delta-T below 12°F = Possible undercharge (along with low airflow)
- Delta-T 15-18°F = Proper charge
- Delta-T above 20°F = Possible overcharge (verify with superheat/subcooling)
Advantages:
- Non-invasive (no manifold gauges needed)
- Quick assessment
- Useful for preliminary diagnosis
Limitations:
- Influenced by airflow, not just refrigerant charge
- Cannot distinguish between low charge and low airflow alone
- Less precise than superheat/subcooling method
Professional Maintenance Protocol Using the 5 Pillars
Successful technicians implement preventive diagnostics using the 5 pillars framework. Regular measurement prevents failures before they occur.
Annual Preventive Measurement Schedule:
| System Type | Measurement Frequency | Key Focus | Action Trigger |
|---|---|---|---|
| Commercial Refrigeration (High-Use) | Monthly | All 5 pillars, discharge temp | >5°F deviation from baseline |
| Standard Commercial HVAC | Quarterly | All 5 pillars, superheat trend | >10°F superheat change, >5°F subcooling change |
| Residential HVAC | Semi-annually | Superheat, subcooling, delta-T | High superheat or low subcooling detected |
| Seasonal/Intermittent Systems | Annually (pre-season) | Complete 5-pillar measurement | Any deviation from previous year baseline |
Baseline Documentation:
For maximum diagnostic power, establish baseline 5-pillar measurements under standard conditions:
- 75°F outdoor temperature
- 72°F indoor temperature
- Normal operating load
- System running 30 minutes at steady-state
Store baseline in service records. Compare all future measurements to baseline—trends reveal developing problems months before failure.
Example Preventive Finding:
September measurement: Superheat 10°F, subcooling 12°F, discharge temp 210°F
December measurement: Superheat 12°F, subcooling 10°F, discharge temp 215°F
March measurement: Superheat 15°F, subcooling 8°F, discharge temp 220°F
Trend Analysis: Superheat rising (+5°F over 6 months) while subcooling falling indicates developing refrigerant leak. Technician schedules preventive maintenance before system fails in hot season.
Advanced Application: Compressor Efficiency and Heat Balance
The 5 pillars also reveal compressor internal efficiency and overall system heat balance.
Heat Balance Principle:
In a properly functioning refrigeration circuit:
Heat absorbed in evaporator + Heat of compression = Heat rejected in condenser
When this balance breaks down, the 5 pillars reveal the imbalance:
Symptom: High Discharge Temperature Despite Normal Pressures
| Finding | Interpretation |
|---|---|
| High superheat | Insufficient evaporator heat absorption |
| High discharge temp | Heat of compression excessive |
| Combined result | Compressor overworking; possible mechanical inefficiency |
Possible Causes:
- Evaporator airflow restriction (frozen coil, dirty filter)
- Refrigerant undercharge (insufficient heat transfer)
- Compressor internal valve leakage
- Discharge line heat loss without sufficient evaporator cooling
Diagnostic Action:
Verify airflow first. Then measure refrigerant charge via superheat. If both normal but discharge temperature still high, compressor mechanical failure is likely.
The Training Advantage: Why Experienced Technicians Diagnose Better
The difference between experienced technicians and trainees isn’t just knowledge—it’s systematic methodology.
Trainee approach:
- “Pressures look low, I’ll add refrigerant”
- Guesses based on incomplete information
- Callbacks when initial diagnosis was wrong
Professional approach:
- Measure all 5 pillars systematically
- Calculate superheat and subcooling
- Compare findings to establish baseline
- Make data-driven decisions
- Document measurements for future reference
The ROI of 5-Pillar Mastery:
- 80% fewer callbacks
- 40% faster diagnosis time
- Confident recommendations customers trust
- Documented evidence when disputes arise
- Professional differentiation from competitors
Conclusion: The 5 Pillars as Professional Foundation
Refrigeration diagnostics separates professional-level technicians from those still relying on guesswork. The 5 pillars—suction pressure, discharge pressure, superheat, subcooling, and saturation temperature relationships—form a complete diagnostic framework that eliminates ambiguity and proves root causes with measurable evidence.
Every technician working on refrigeration systems should master these five pillars before advancing to specialized diagnostics like thermal imaging or compressor valve analysis. The 5 pillars are the foundation. Everything else builds from there.
The professional standard is clear: Measure all 5 pillars on every refrigeration service call. Your diagnostic accuracy, customer confidence, and professional reputation depend on it.
RECOMMENDED IMAGES & RESOURCES
Exclusive Images for Article:
- Manifold gauge set positioned on refrigeration system – Shows proper gauge connection points
- Safe source: HVAC equipment manufacturer documentation
- P/T Chart reference material – Pressure-temperature conversion chart for common refrigerants
- Safe source: EPA documentation or refrigerant manufacturer technical data
- Thermometer probe placement diagram – Shows correct measurement locations for superheat and subcooling
- Safe source: Professional HVAC training materials (create custom diagram)
- 5-Pillar diagnostic flowchart – Visual decision tree showing how 5 pillars connect
- Safe source: Original creation based on technical standards
- Digital manifold gauge display – Shows superheat/subcooling automatic calculation
- Safe source: Equipment manufacturer product photos
- Compressor discharge line thermal imaging – Shows temperature monitoring technique
- Safe source: Professional HVAC thermal imaging documentation
Recommended PDF/Catalog Resources (Verified Safe):
- EPA Refrigerant Safety and Handling Guidelines
- Download: epa.gov/ozone/refrigerant-recovery
- Verification: Official EPA documentation ✓
- ASHRAE Handbook – Fundamentals Chapter on Refrigerants
- Professional refrigerant properties and P/T relationships
- Verification: ASHRAE (American Society of Heating, Refrigerating and Air-Conditioning Engineers) ✓
- Copeland Compressor Technical Bulletins – Pressure-Temperature Charts
- Download: copeland.emerson.com/technical-documentation
- Verification: Major compressor manufacturer ✓
- Johnson Controls HVAC System Commissioning Guide
- Professional system startup and measurement procedures
- Verification: Equipment manufacturer technical documentation ✓
- HVACR School – Superheat and Subcooling Reference Chart
- Professional training organization technical resources
- Verification: Industry training authority ✓
- Refrigerant Pressure-Temperature Charts (EPA/Dupont)
- Official P/T conversion reference for all common refrigerants
- Verification: Refrigerant manufacturer official data ✓